404
We couldn't find what you are looking for.
You could also try something else or check out these popular areas of our site.

Programs and Courses
Programs, courses, apprenticeship training, baccalaureate degrees, continuing education and post secondary studies available at SAIT, Calgary, Canada.
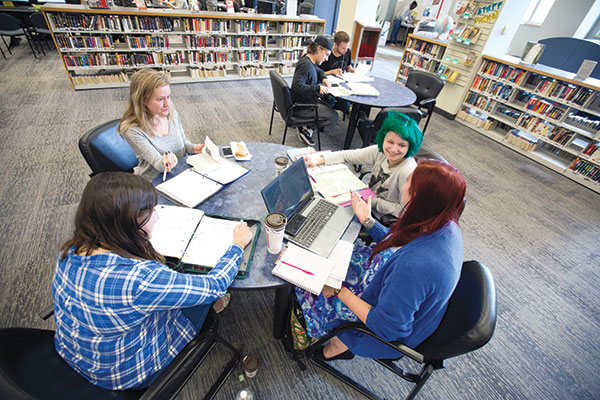
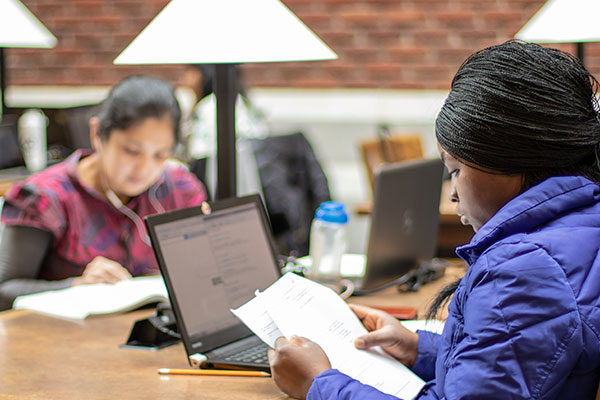
The Library
The Reg Erhardt Library is your best resource for finding current, accurate information for your research, assignments and projects.

Information Sessions
Get the information you need to prepare for a strong start in your chosen program or get the details that will help you make the right choice about your future.

International Students
In addition to all our regular student services, we offer special support for international students at all stages of their journey, from application to graduation.

Apply
You've reviewed how to apply, have chosen your program and now you're ready to start your application. Apply now for fall and winter.
Tuition & Fees
Learn more about your tuition deposit, tuition payment and deadlines and financial assistance to pay for your education at SAIT.
Office of the Registrar
Office of the Registrar informs and supports our current and future students from initial inquiry through to graduation and employment.

How to Apply
Each of our programs has specific requirements and application procedures — find out when and how to apply for your program.

Academic Upgrading
Prepare for your future with academic upgrading courses in English, mathematics and the sciences. Offered during the day, evening and online.
Admissions
Get started on the career of your dreams. Find out about admission and selection, how to apply, tuition and financial aid and more.
Why study at SAIT
Start shaping your future with SAIT's technology-enriched learning. Through relevant, action-based learning in your chosen field, we'll give you the edge you need to shape your world and career.

SAIT Update
Stay up to date with important announcements and news and get connected to resources to help you make the most of your time here at SAIT.

Technical Support
Technical support — which includes help with computer hardware and software technical problems, email, audio-visual needs and more — is available to everyone at SAIT, whether the problem occurs at home or on-campus.
SAIT Alumni
Join our welcoming community. As a global leader in applied education, we invite you to discover more about why SAIT is a top destination for international students from around the world.
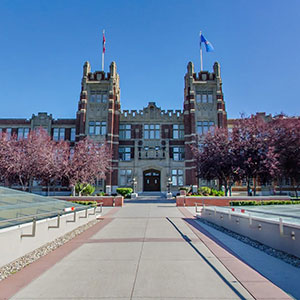
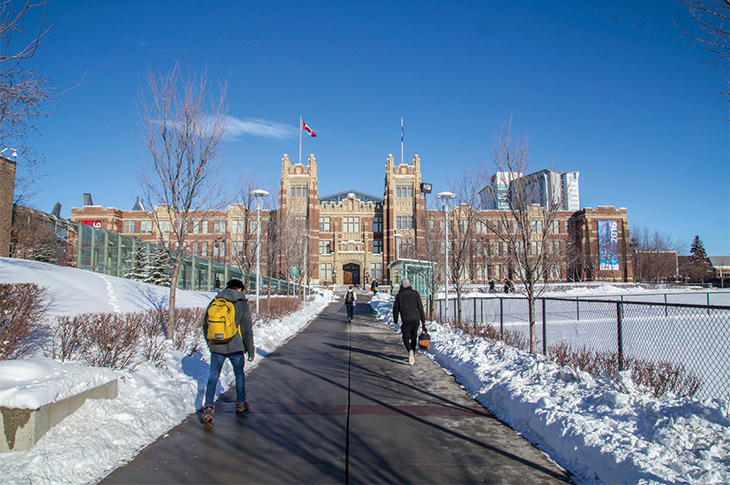
Campus Map
SAIT Main Campus
1301 16 Ave NW
Calgary, Alberta, CANADA
T2M 0L4
Directions
Building hours | Campus map
Still not sure where to go? Check out our programs and courses. Or reach out and contact us. We will be happy to help you.

Oki, Âba wathtech, Danit'ada, Tawnshi, Hello.
SAIT is located on the traditional territories of the Niitsitapi (Blackfoot) and the people of Treaty 7 which includes the Siksika, the Piikani, the Kainai, the Tsuut’ina and the Îyârhe Nakoda of Bearspaw, Chiniki and Goodstoney.
We are situated in an area the Blackfoot tribes traditionally called Moh’kinsstis, where the Bow River meets the Elbow River. We now call it the city of Calgary, which is also home to the Métis Nation of Alberta.